
Feature Importance with SHAP: Easily Interpret Your ML Models
No more guessing your XGBoost or Neural Network

I was living a lie.
Training machine learning models in school felt like magic.
I remember working on linear regression models with training features I could count on two hands, almost no noise, and feature relationships that felt almost too predictable.
So believe me, it was a humbling experience training my first predictive model at work and realizing just how in over my head I was.
That’s when I turned to more advanced models like XGBoost. And while they captured patterns far better than my school projects, they introduced a new challenge:
The more complex the model, the harder it is to explain.
The goal: Interpretability over complexity
You may be thinking, But if the model works, who cares!?
Believe me, I’ve asked myself that question many times
And over the years of working as a Data Scientist, I’ve learned that in the real world, the lack of interpretability of “black-box” models makes them less impactful.

Without interpretability:
It’s impossible to debug issues
Build stakeholder trust
Identify when the model is relying on irrelevant patterns.
This is why SHAP’s ability to break down complex models into simple, understandable parts and show exactly how each feature contributes to a prediction is a true game-changer compared to other methods.
Overview
This is what we’ll cover today:
Understand the limits of traditional feature importance
A high-level overview of SHAP
Practical examples and interpretation of SHAP
1—Understand the limits of traditional feature importance
One huge advantage of using a gradient boost model like XGBoost is that it comes with a built-in function that lets you easily retrieve the importance score of each feature with just a single line of code.
In the case of XGBoost, it looks like this:
# Plot feature importance
xgb.plot_importance(model)
This may sound great at first, but the more you try to use it, the more you realize it falls short in many areas.
Here is the problem:
Ignores feature interactions: Traditional methods assume features act independently, which isn’t true in real-world data where features often work together. This leads to misleading results when features are correlated.
Lacks local explanations: They only show which features matter overall but can’t explain individual predictions. For instance, why was one customer classified as a default risk? You’re left guessing.
Unfair attribution: Features that appear earlier in tree splits or interact with others can be over- or under-represented, distorting your understanding of what’s driving the model.
💡 In short, traditional feature importance methods give you a high-level view, but they don’t help when you need deeper, actionable insights.
2—A high-level overview of SHAP
SHAP (SHapley Additive exPlanations) can make even the most complex models interpretable. The fact that it’s model agnostic, working with anything from tree-based models to neural networks or ensembles, makes it incredibly versatile in practice.
At its core, SHAP asks:
“If we remove this feature, how much does the prediction change?”
💡 It evaluates every possible combination of features to calculate how each one contributes to the model’s output. Using Shapley values from game theory, SHAP ensures that the credit is distributed fairly, even when features interact or are highly correlated.
Types of insights SHAP provides
Global explanations (Big picture)
SHAP shows which features have the greatest overall impact on the model, helping you understand what drives its predictions at a high level.

Local explanations (Specific predictions)
SHAP breaks down individual predictions, showing how each feature pushes the result higher or lower. This is especially useful when explaining specific results to stakeholders.


Feature interactions
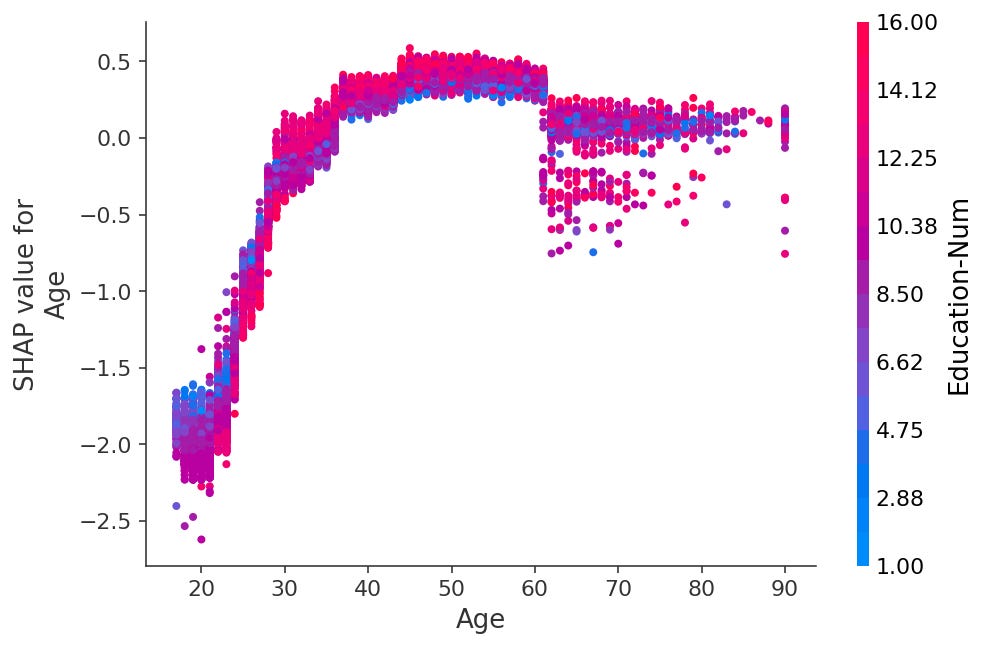
SHAP reveals how features interact, helping you identify relationships that traditional methods overlook. For example, how age and income together influence a prediction.

SHAP turns complex models into clear, interpretable insights, bridging the gap between accuracy and trust. It makes debugging, optimizing, and explaining your results straightforward
3—Practical examples and interpretation
Now, I must admit that when I first started working with SHAP, it took me some time to make sense of the plots.
So let me help you cut through the confusion and show you how to interpret SHAP’s most important visualizations step by step.
📣 What perks do you get as a paid subscriber?
Full access to all public + premium posts.
A free copy of my Data Science Project Ideas PDF (2025 edition).
A free copy of “Data Science Interview Case Studies (2025 Edition)“.
A 25% off coupon for a 1:1 mentoring session.
Occasional live Q&As and exclusive workshops.