
5 Underrated Pandas Techniques to Make EDA Easier
Guess what! There is a function for that...

📣 Stay ahead in AI, ML, and data science

AI is evolving so rapidly that it can feel impossible to keep up.
Neural Pulse makes it easier by delivering curated breakthroughs, tools, models, and other insights in a quick, 5-minute read (perfect for busy professionals)
Honestly, doing EDA with Pandas can feel overwhelming
That’s how I used to think before I realized I wasn’t using Pandas to its full potential.
Turns out, the problem wasn’t the library. It was me.
Because 9 times out of 10, if you’re stuck solving a repetitive or tedious task, there’s already a function for that.
So I wanted to bring you five underrated Pandas techniques that will take your EDA to the next level.
And I can bet you there is at least one you haven’t tried yet.
💡 Oh and at the end of the article I’ll leave you the link to a notebook with all of these techniques in case you want to try them out yourself.
1. Analyze relationships with .crosstab()
Use .crosstab() to analyze relationships between categorical variables. It’s perfect for creating frequency tables or exploring distributions across multiple dimensions.
When to use it:
Suppose you’re exploring how product preferences vary by gender in a marketing campaign. With.crosstab(), you can quickly see how different demographics engage with product categories, helping you identify trends and optimize your strategy.

💡 Pro tip: Add percentages with normalize=True for proportional analysis.
2. Detect outliers with .quantile()
Outliers can skew your analysis. With .quantile() you can calculate the interquartile range (IQR) to identify potential outliers and understand the distribution of your data.
When to use it:
Imagine you’re analyzing sales data across different stores and notice a few locations with unusually high or low revenue. By calculating IQR, you can identify and investigate these anomalies to determine if they’re errors or genuine outliers worth addressing.

💡 Pro tip: Pair these results with visualizations like boxplots to confirm your findings.
3. Unpack nested data with .explode()
Working with columns that contain lists or nested data? .explode() makes it easy to break these down into individual rows for better analysis.
When to use it:
Consider a dataset of customer feedback where each review is tagged with multiple topics (e.g., ['delivery', 'quality']). Analyzing these tags in their current nested format is challenging. By using.explode(), you can turn each tag into its own row, making it much easier to count and analyze trends.

💡 Pro tip: Pair it with .value_counts() for quick insights.
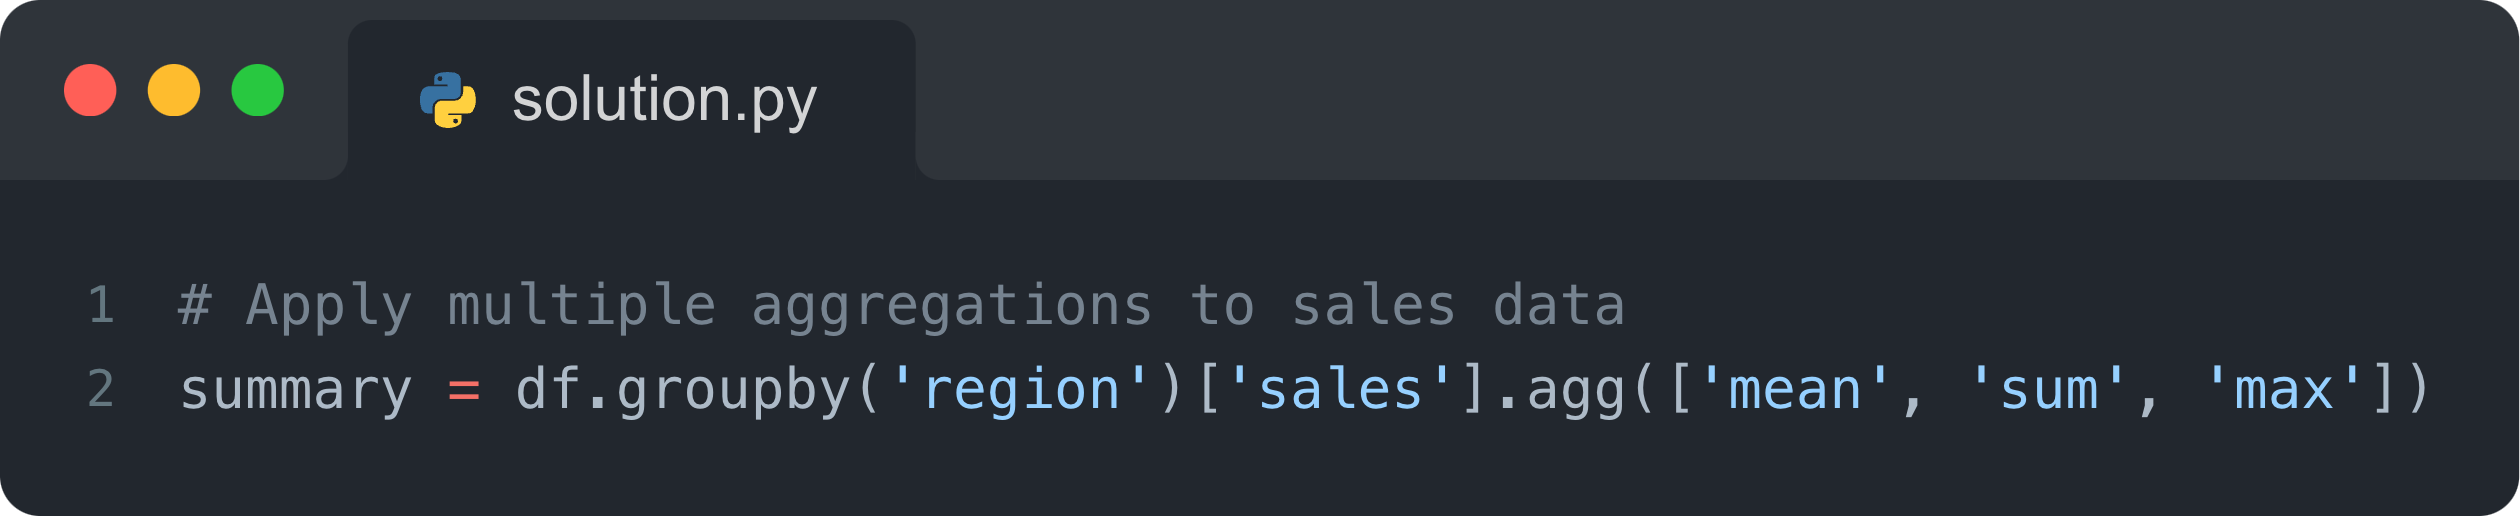
4. Simplify aggregations with .agg()
Combine multiple aggregation operations in one step using .agg(). This is especially useful for summarizing data across different metrics.
When to use it:
Imagine you’re analyzing regional performance for a business and need to compute multiple KPIs—like average sales, total revenue, and maximum order size—for each region. Instead of running separate calculations,.agg()lets you do it all at once.
5. Streamline transformations with .pipe()
Keep your code clean and modular by chaining multiple transformations with .pipe(). It’s perfect for applying custom functions in a workflow.
When to use it:
Let’s say you’re preprocessing survey data that requires several steps: filling missing values, normalizing scores, and creating new features. Instead of writing messy, chained code, use.pipe()to apply each transformation in an organized, readable way.

Try it out yourself
Check the notebook via Google Colab here.

Conclusion
These five Pandas techniques are powerful yet often underutilized when it comes to EDA.
Add them to your toolkit to save time, improve your analysis, and uncover deeper insights.
Thank you for reading! I hope this article helps you during your next analysis.
See you next week!
- Andres
Before you go, please hit the like ❤️ button at the bottom of this email to help support me. It truly makes a difference!
My Recent Posts 📩
Maximizing Revenue in E-Commerce Through Dynamic Pricing: A Data Science Business Use Case
Better Datasets For Your Next Data Science Portfolio Project
How to Approach Churn Reduction in Subscription Services: A Data Science Business Use Case
Feature Importance with SHAP: Easily Interpret Your ML Models
Great post Andres. So insightful. The pipe() method is something that will make building an end-to-end process for transforming data super simple and clean. Thanks for sharing this
Amazing man, I'm actually using .pipe() right now.