
Testing the Limits of PandasAI (Part 1): What It Can (and Can’t) Do to Help Data Scientists
Using AI to optimize your analysis workflow

I remember when I first heard of PandasAI back in late 2023.
ChatGPT-4 had just been released, and we were seeing the first waves of people trying to bolt LLMs onto real data workflows
What an exciting time!
Naturally, I had to try PandasAI myself and see what all the hype was about. I mainly wanted to see if you could really “talk to your data“ and finally solve my problem of forgetting Pandas and Matplotlib syntax.
Long story short, PandasAI was cool, but it wasn’t very useful in practice.

And for us Data Scientists, who already juggle countless tools and syntax, adding another step is only worth it if it truly brings value.
Fast forward to 2025, LLMs have gotten MUCH better, especially at logic and coding tasks, and PandasAI has, of course, continued to evolve.
So a few months ago, I decided to give it another shot as I’ve been integrating AI more into my data science workflows (more about this at the end of the article 😉).
Now I want to share where PandasAI stands today, and most importantly, what it can (and cannot) do to help us streamline our work.
Here’s a sneak peek at what we’ll cover:
What PandasAI is and a peek at how it works behind the scenes
A few hands-on examples: filters, aggregations, and quick plots
Benchmarks across small and larger datasets, and why IO isn’t the real test
Common struggles like unclear field names, ambiguous queries, and LLM latency
Practical tips to make it work better in your own workflow
A look ahead at advanced features like Agents and domain training, which I’ll dive into in Part 2
What is PandasAI?
For those of you who have not come across it yet, PandasAI is an open-source Python library that extends the popular pandas library with natural language capabilities.
Instead of writing pandas or matplotlib code, you can ask a DataFrame a question in plain English, such as “Show me the top 10 customers by total spend,” and PandasAI will generate, execute the code for you, and output the answer.
The promise is straightforward: reduce the repetitive overhead of coding in pandas and let you focus more on the analysis itself.
How does PandasAI work under the hood?
Now, let me break down what actually happens under the hood when you ask a question to PandasAI:
Input: You ask a question with
DataFrame.chat()orAgent.chat().Prompt building: PandasAI collects column names, a few preview rows, and metadata from your DataFrame, then inserts that along with your question into a template for the LLM.
LLM output: The LLM generates a snippet of Python code designed to answer your query.
Validation: The code is parsed, checked for safety, and prepared for execution.
Execution: The code runs locally on your DataFrame using pandas or DuckDB.
Result: The output is returned as a number, a table, or a plot, and stored in the conversation memory so you can follow up with new questions.
💡 That means, PandasAI doesn’t send your entire dataframe to the LLM, it only sends the necessary context and then executes the necessary code to find your answer. This a crucial piece of information that we will discuss in later sections.
In the next section, I will show you what this looks like in practice with a few examples.
PandasAI in practice
Now that we understand how PandasAI works in theory, let’s see how it actually performs in practice.
As of writing this article, I’m testing PandasAI 3.0 (or 3.0.0b2 to be exact). I won’t go over how to install it, you can find that information in the GitHub repo or the full documentation.
But it’s good for you to know that this is most of the code you need to get started using PandasAI:
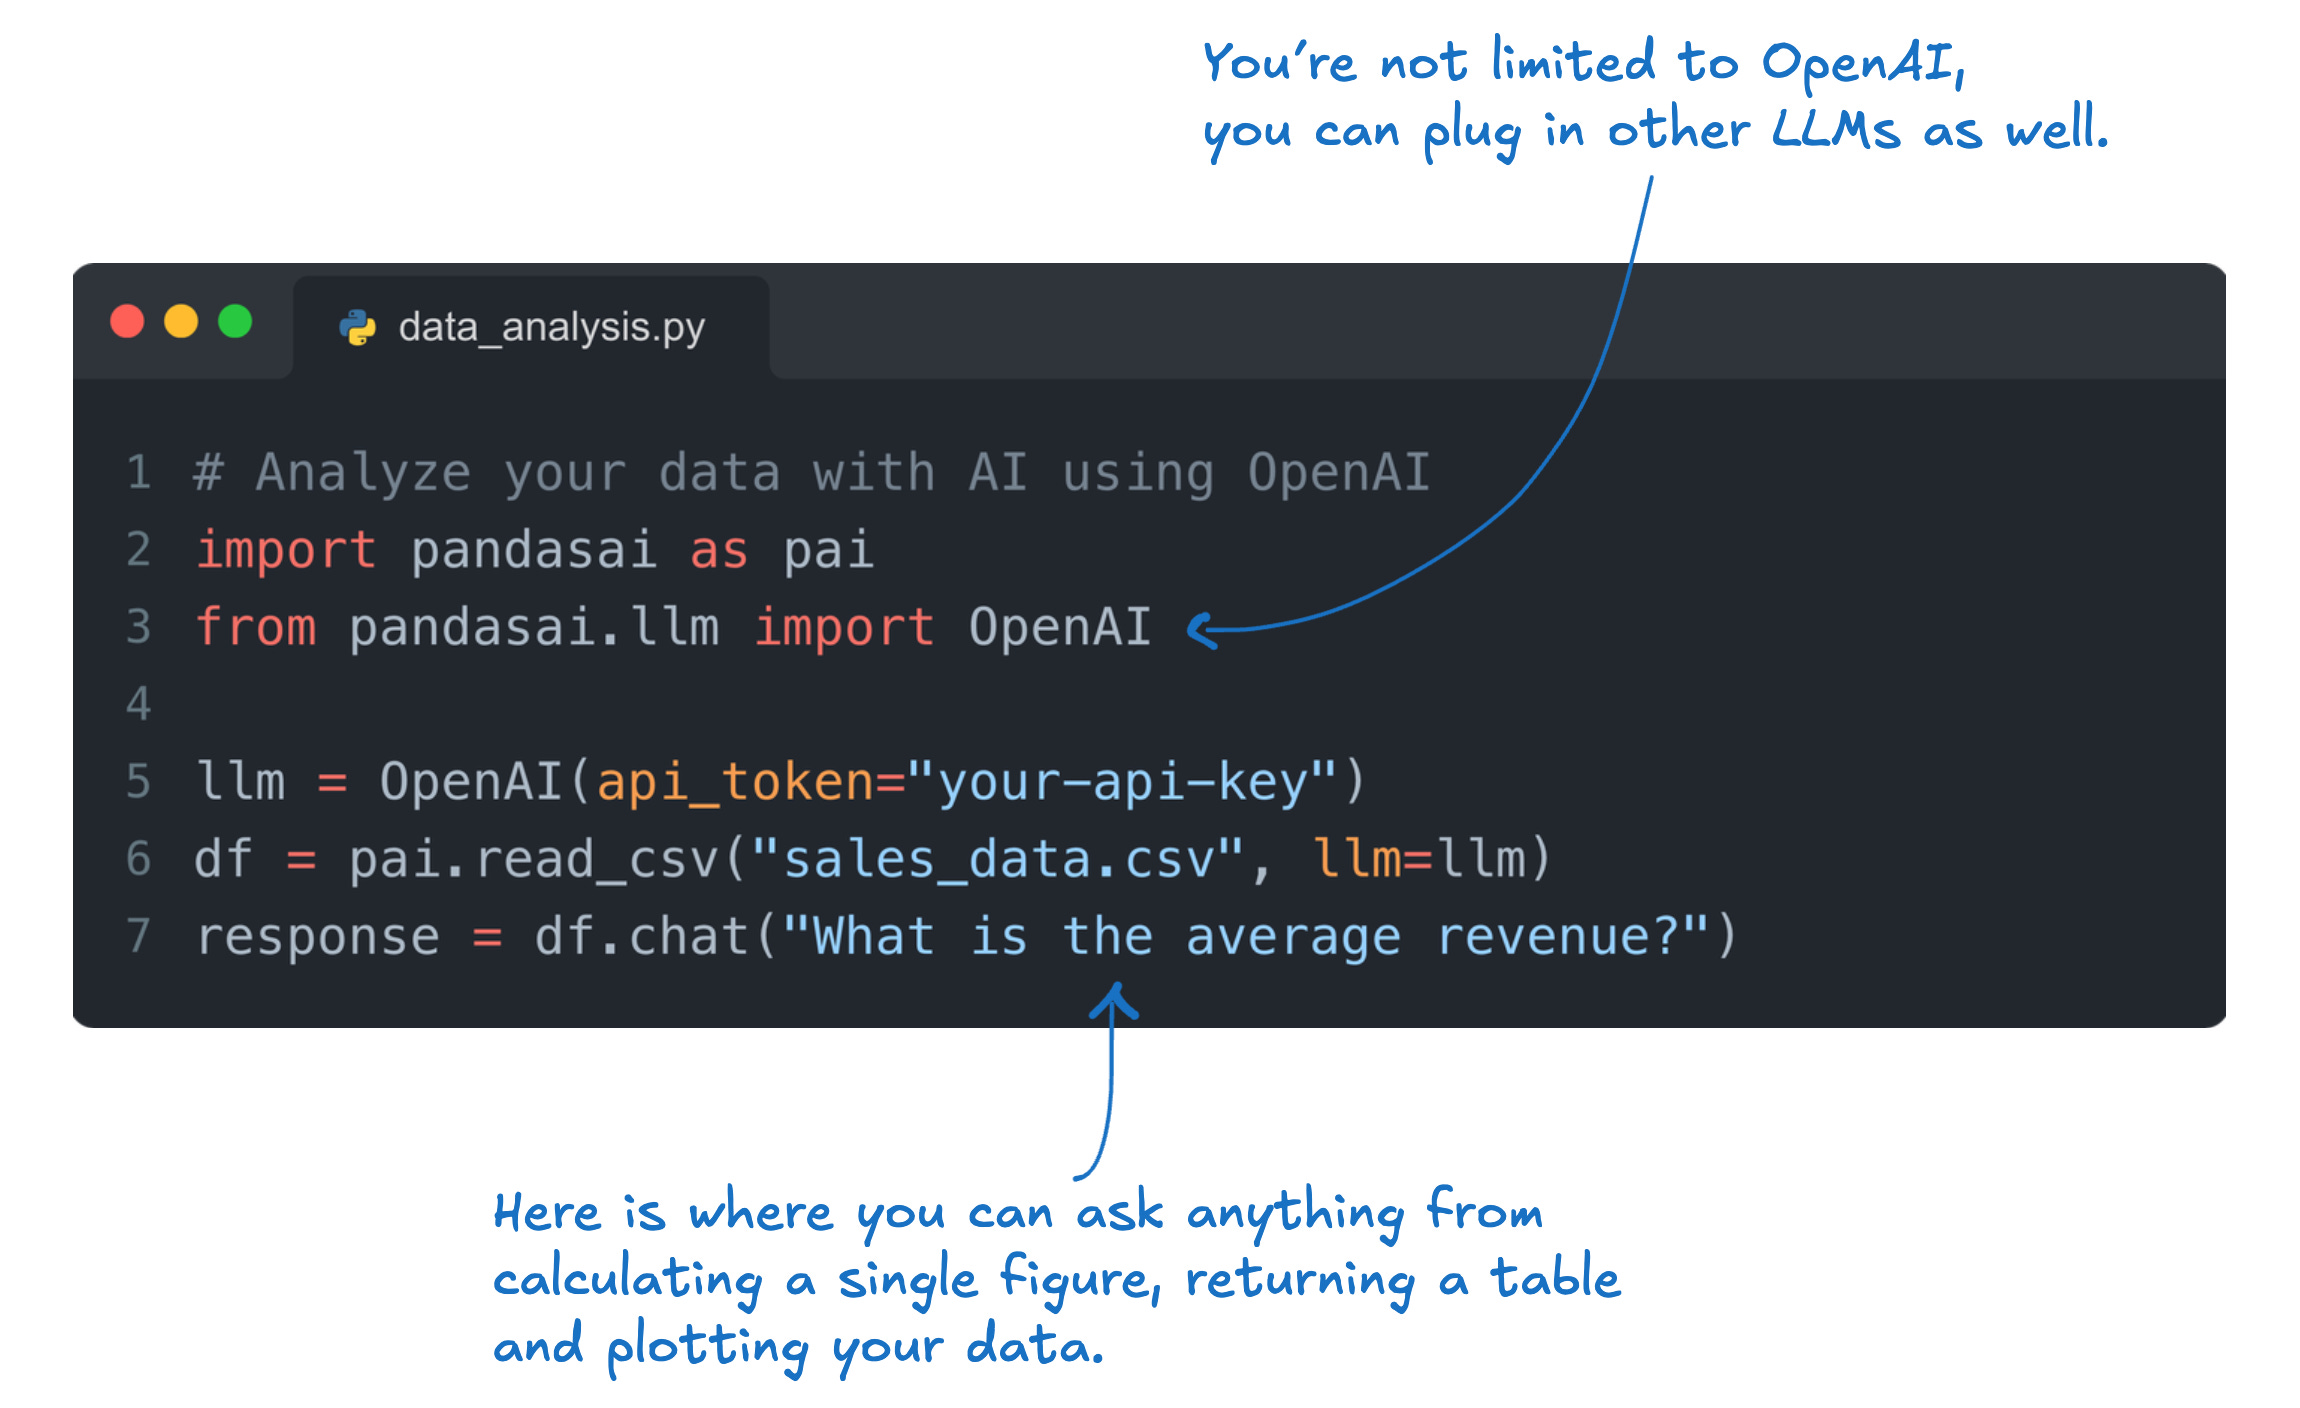
It’s very straightforward:
You import your data in the same way you would with pandas
You use the
.chat()function to talk to your data
Simple EDA test
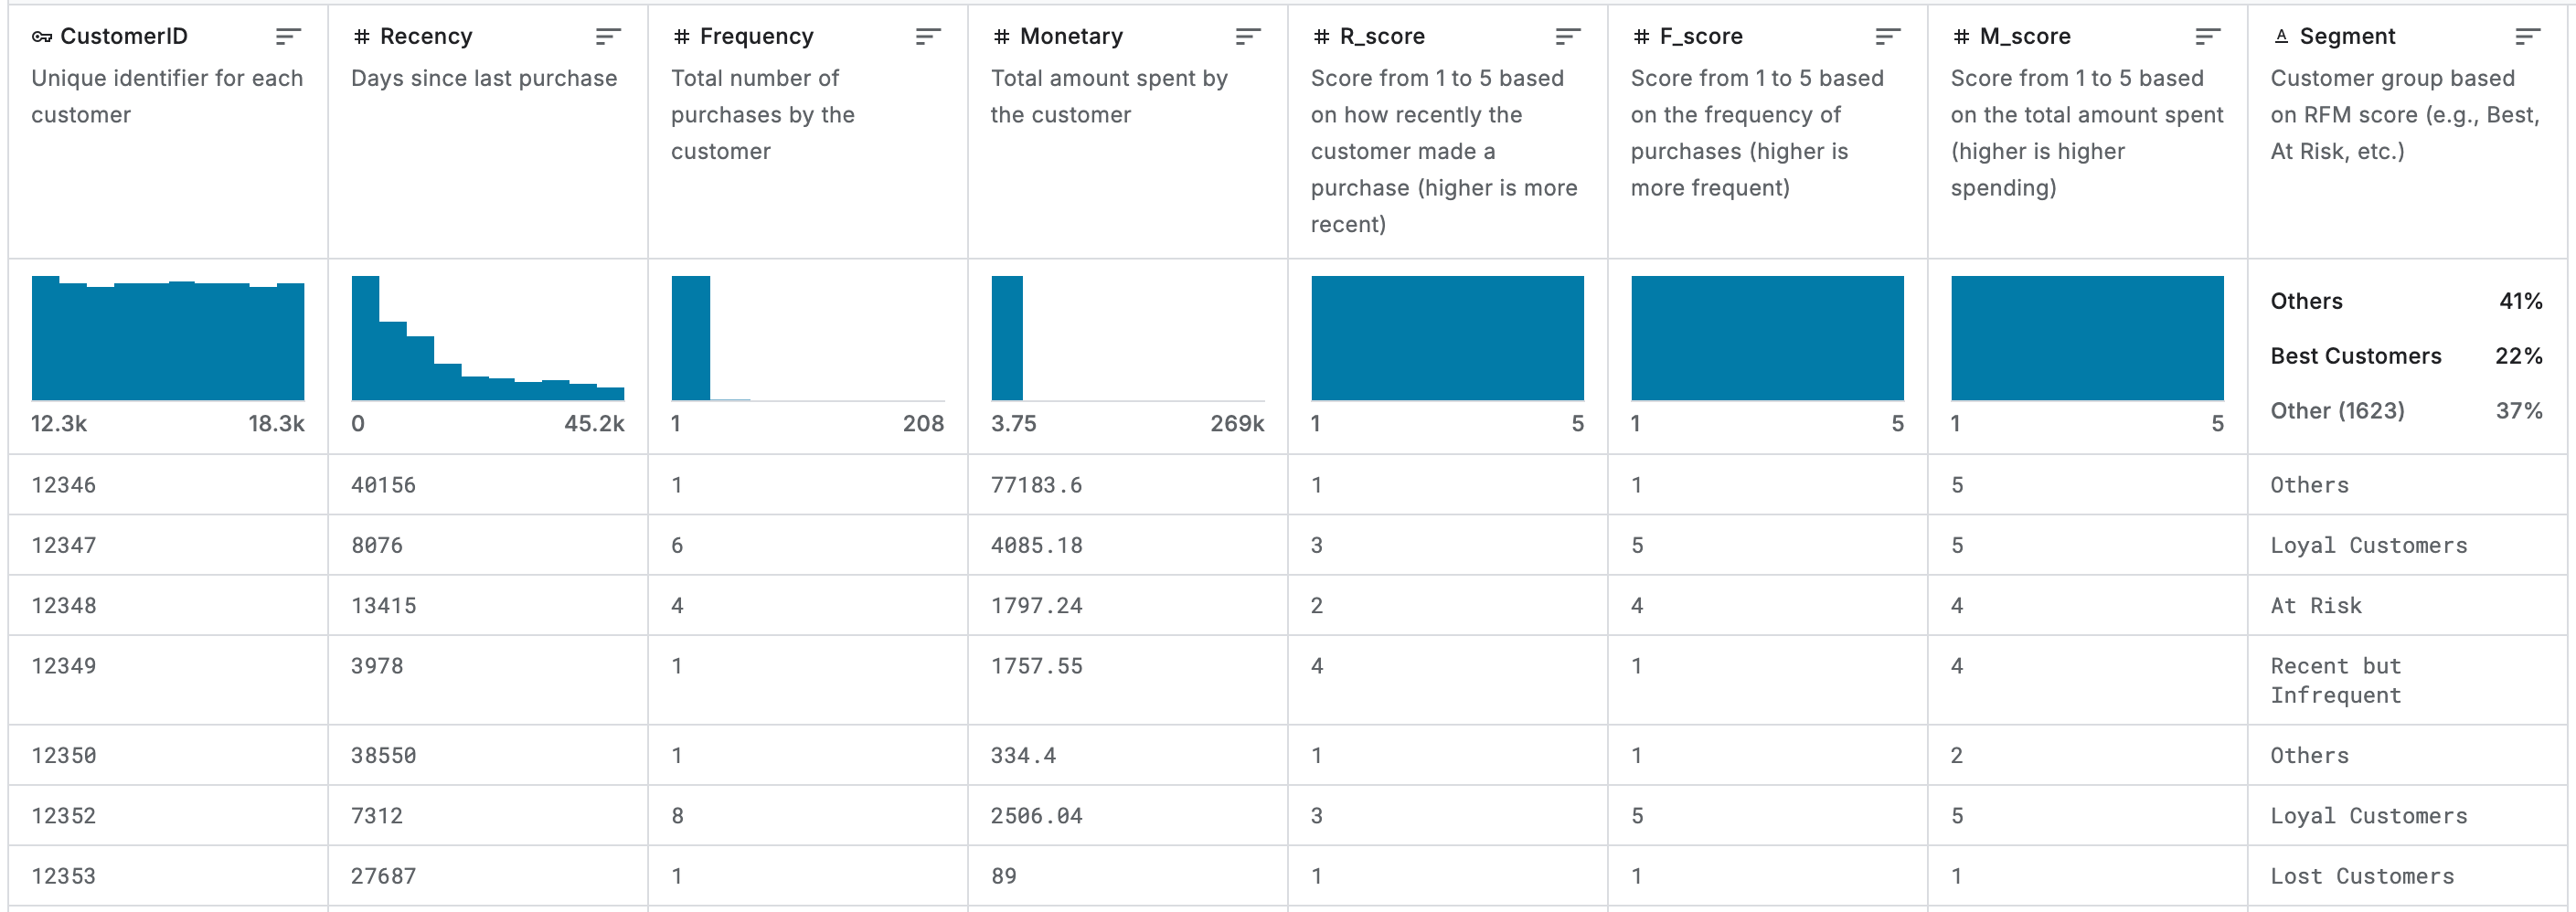
Alright, so for the tests I run, I used this “E-commerce Customer Behavior“ dataset I found on Kaggle.
This data is used to analyze e-commerce customer behavior using RFM segmentation and visualize customer patterns. It has about 5000 rows and 9 columns, and it’s the typical dataset you would use to build a dashboard or do some light EDA.
I asked 7 questions, the typical transformations you would want to do if you were doing exploratory analysis of this dataset:
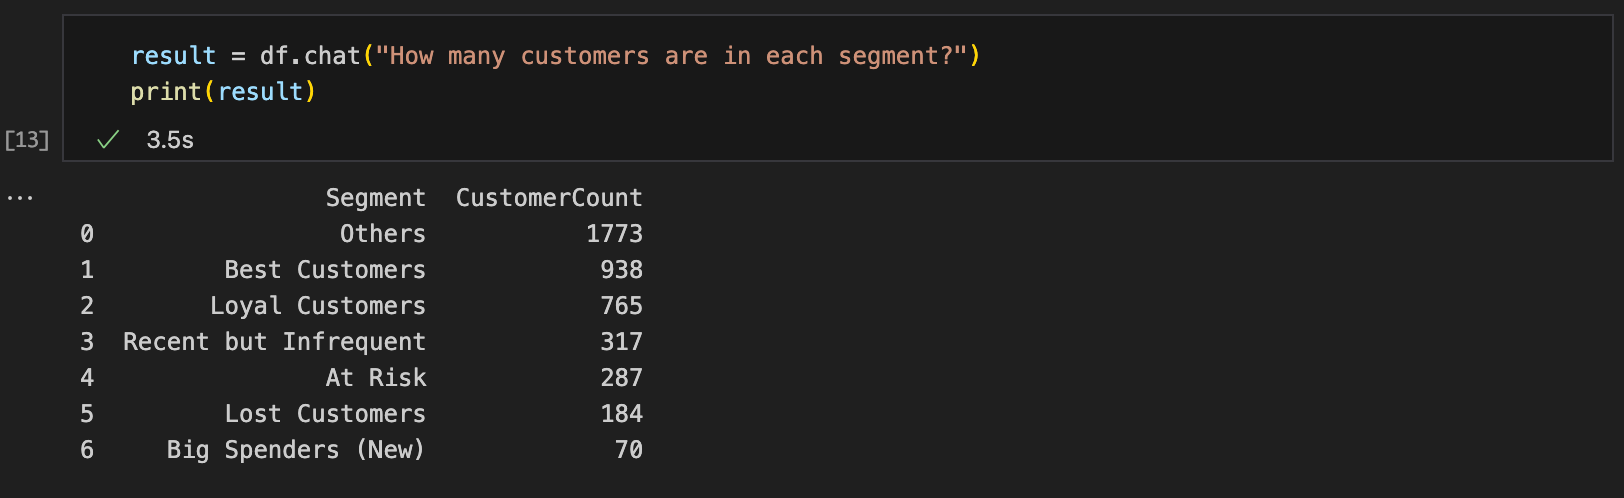
How many customers are in each segment?
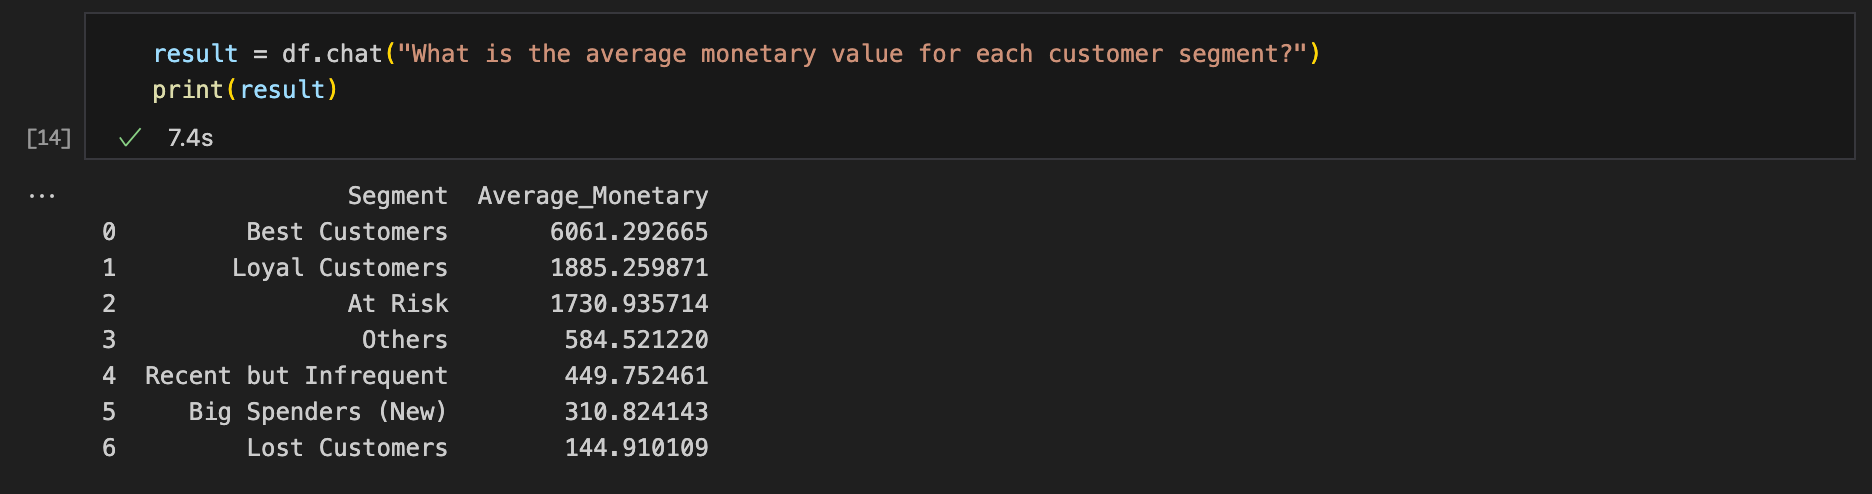
What is the average monetary value for each customer segment?
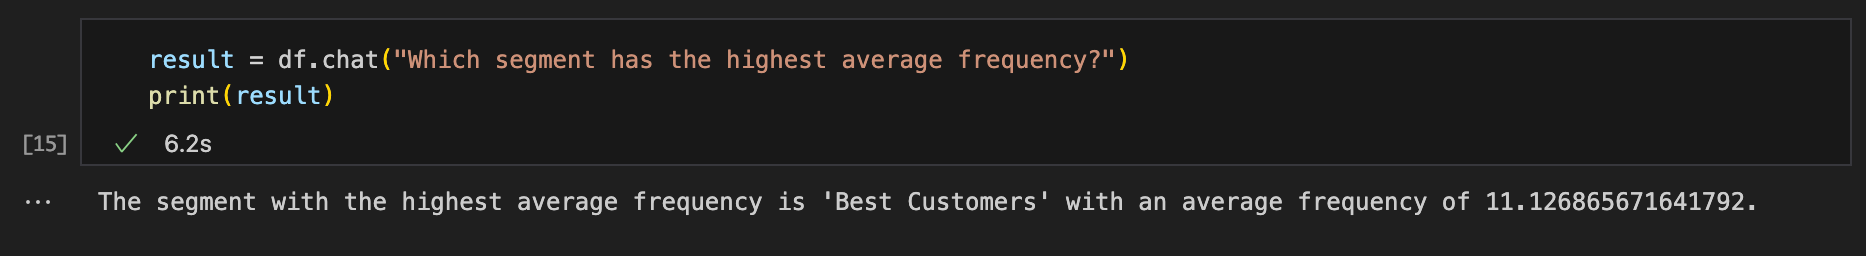
Which segment has the highest average frequency?
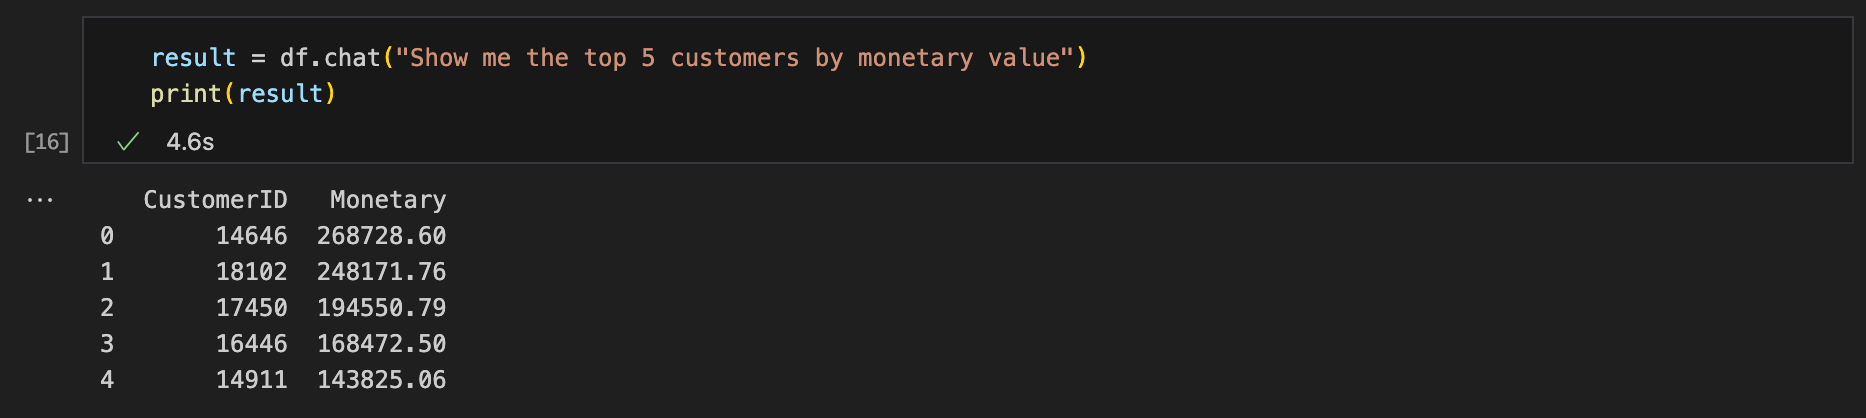
Show me the top 5 customers by monetary value
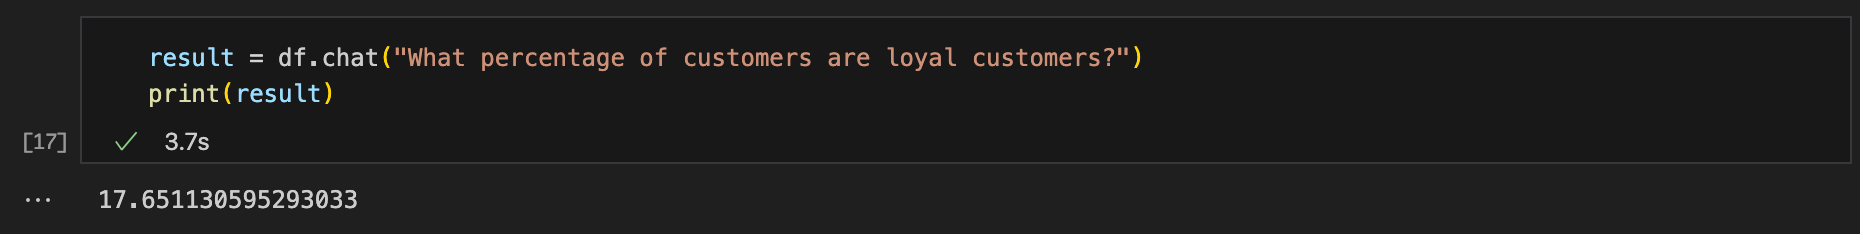
What percentage of customers are loyal customers?
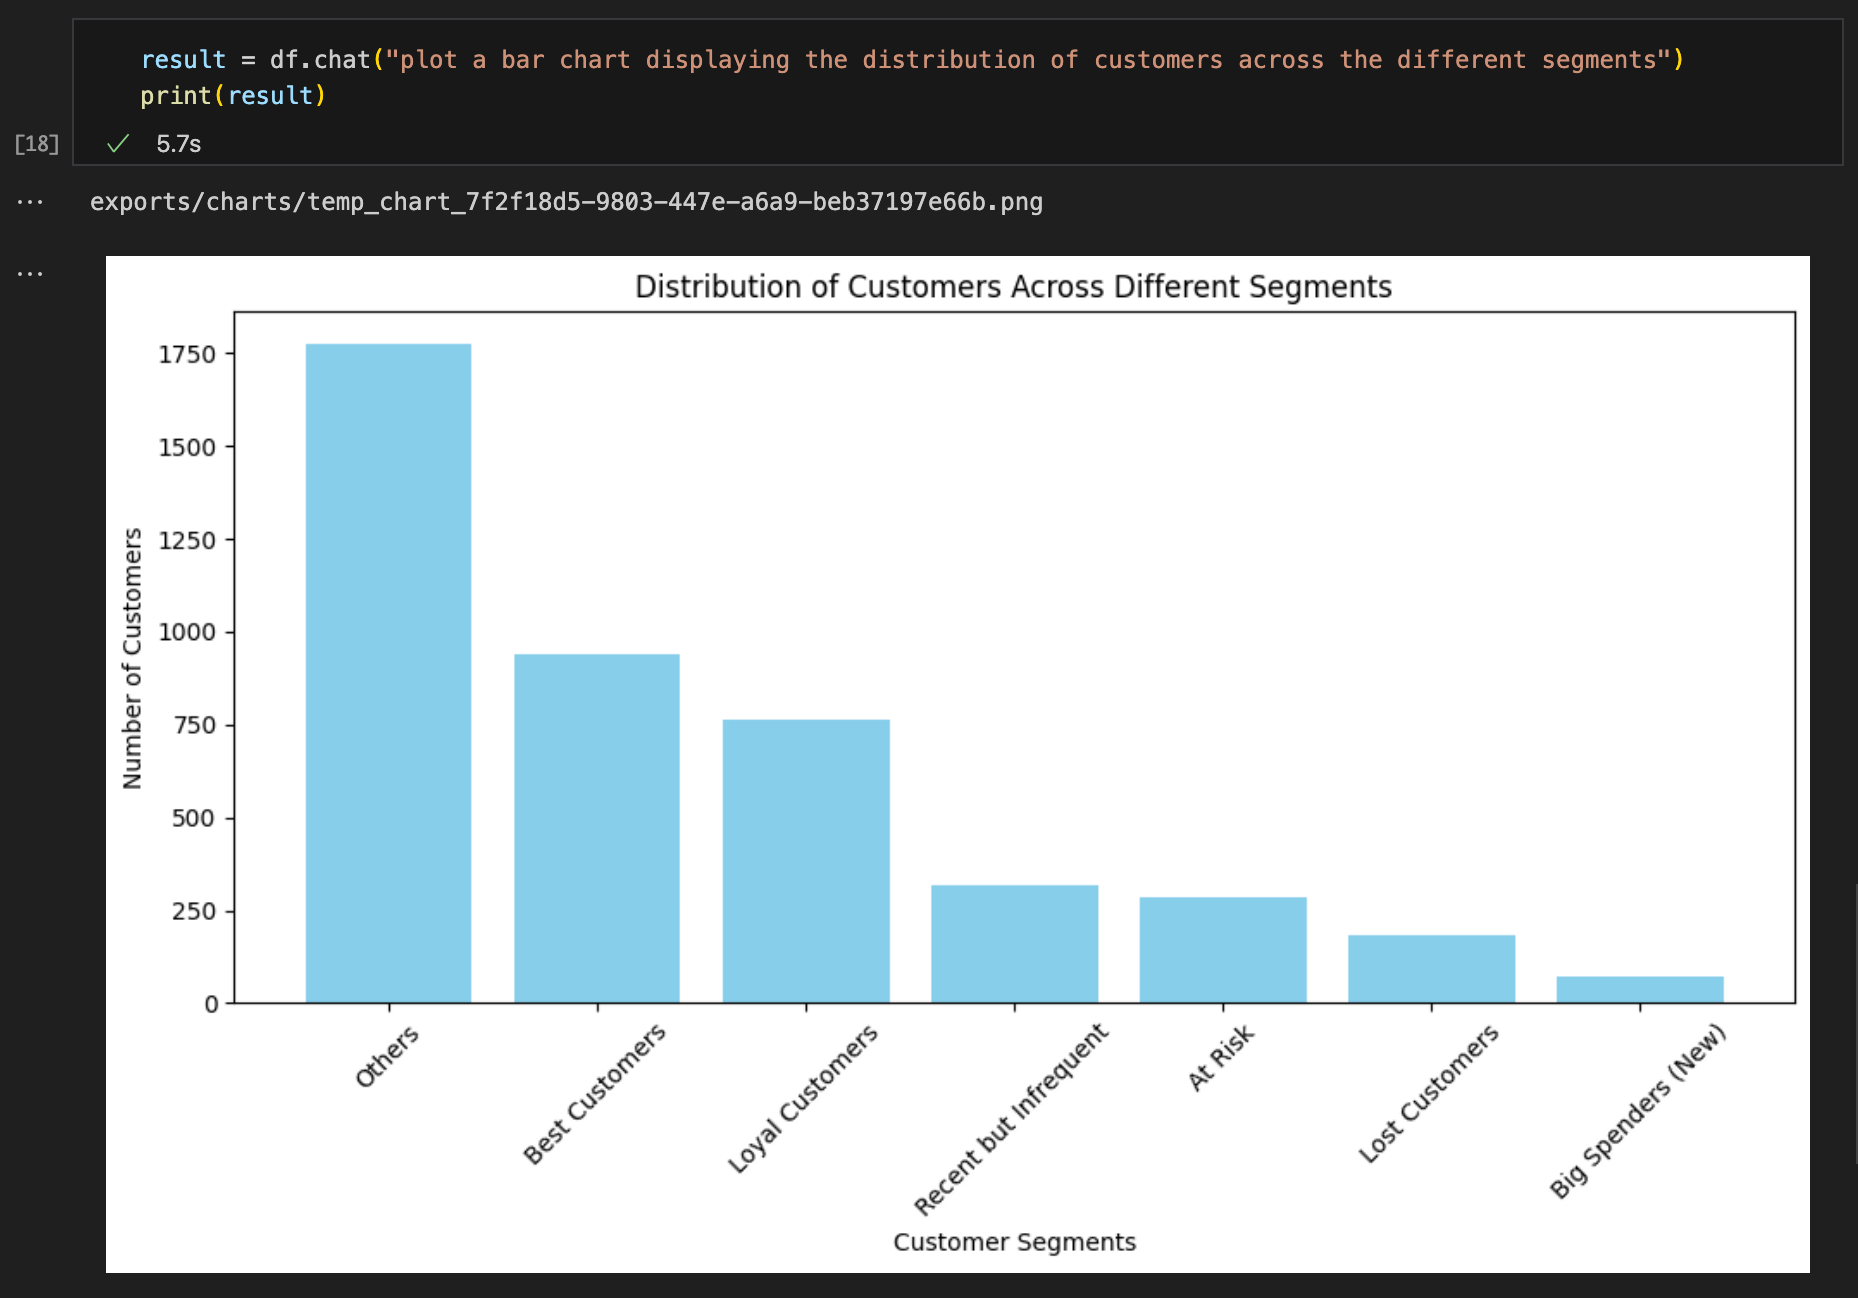
Plot a bar chart displaying the distribution of customers across the different segments.
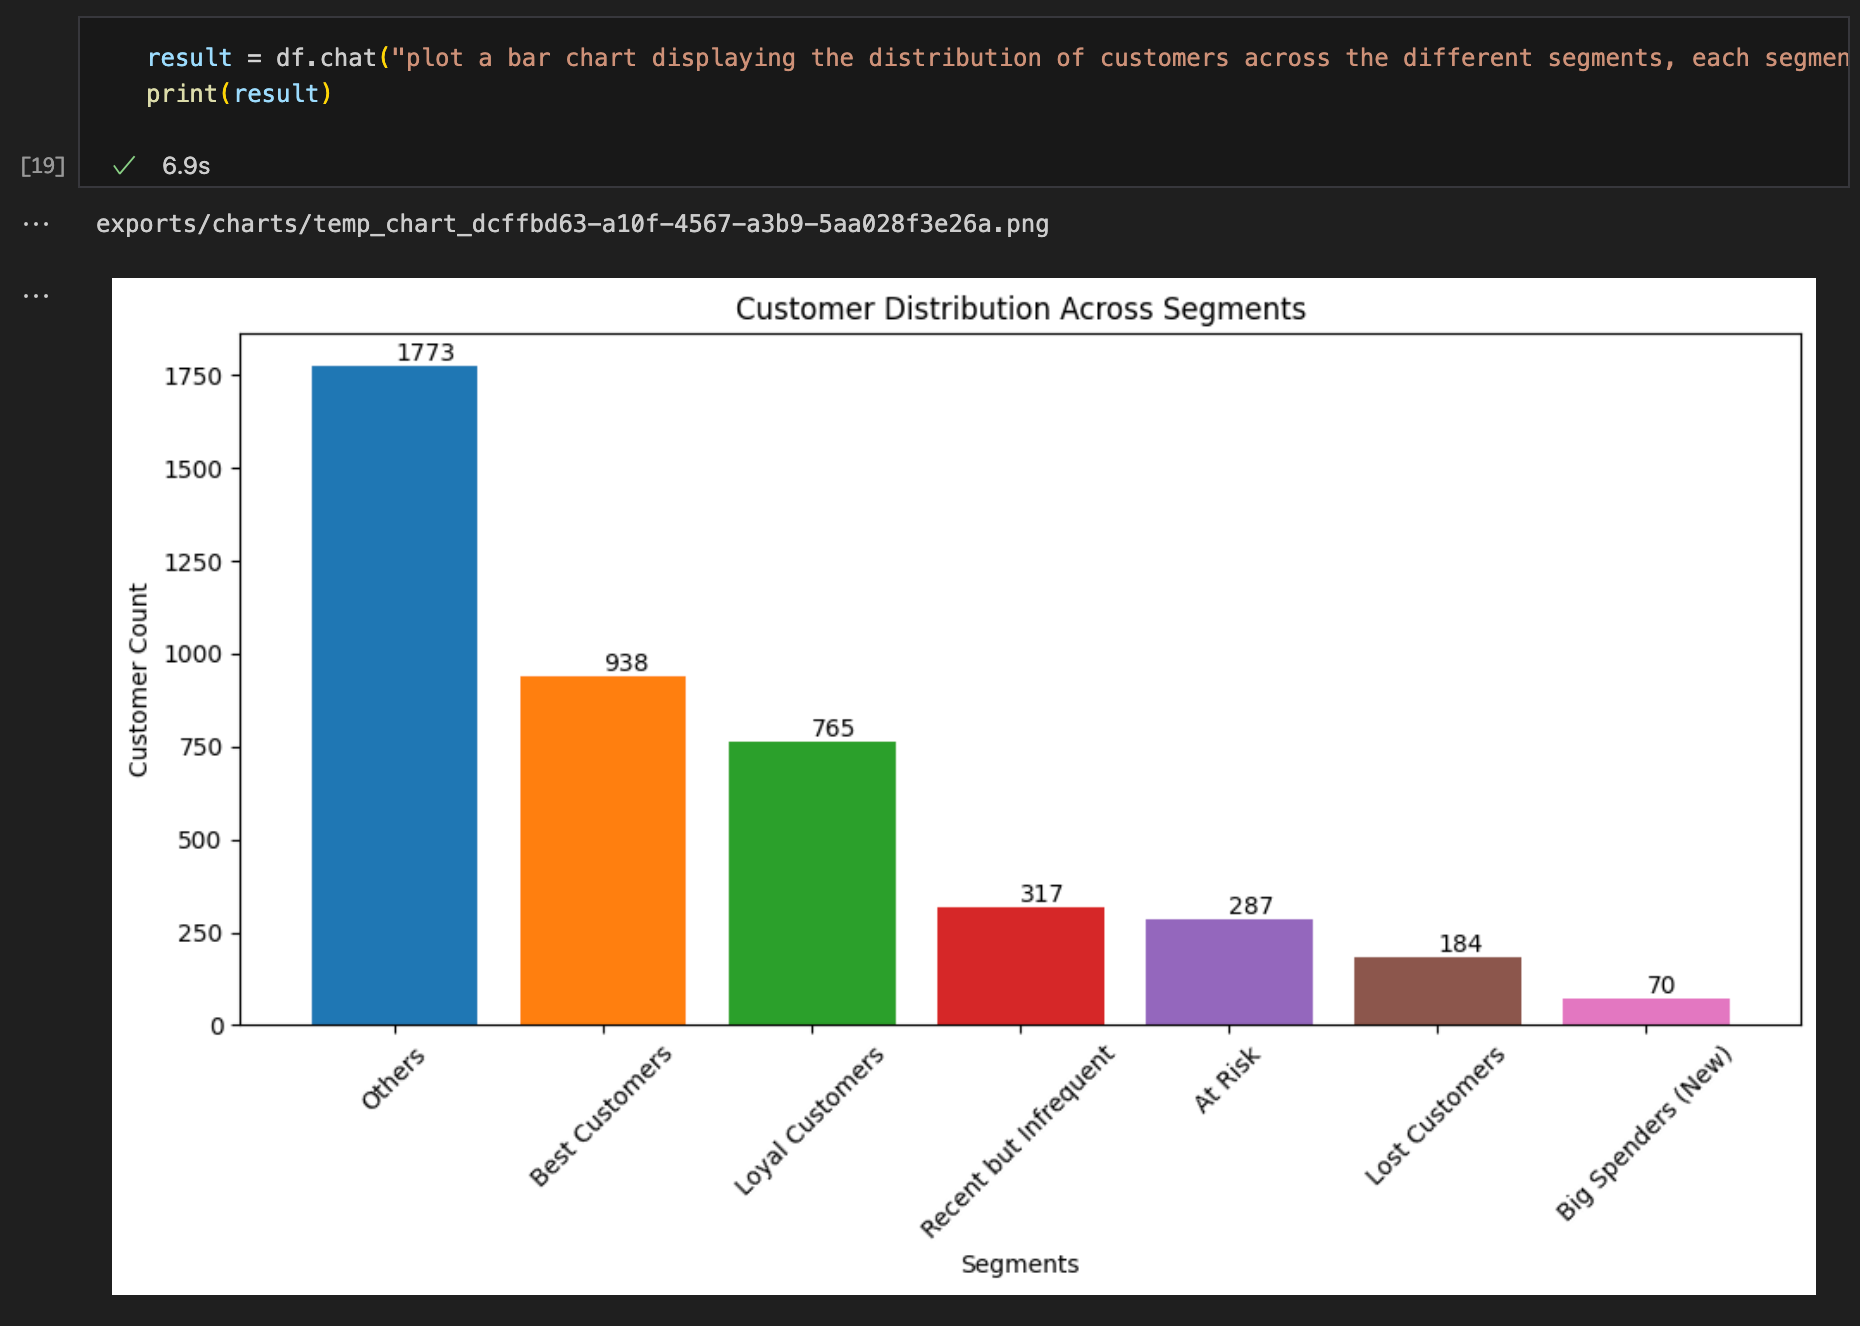
Plot a bar chart displaying the distribution of customers across the different segments, each segment should be a different color, and the bars should be labeled with the customer count.
Let’s see how it went…
The test results
Query #1: “How many customers are in each segment?“
Expected result format: Table ✅
Result accuracy: Correct ✅
Query #2: “What is the average monetary value for each customer segment?“
Expected result format: Table ✅
Result accuracy: Correct ✅
Query #3: “Which segment has the highest average frequency?“
Expected result format: Sentence ✅
Result accuracy: Correct ✅
Query #3: “Show me the top 5 customers by monetary value?“
Expected result format: List ✅
Result accuracy: Correct ✅
Query #5: “What percentage of customers are loyal customers?“
Expected result format: Single figure (or sentence) ✅
Result accuracy: Correct ✅
Query #6: “Plot a bar chart displaying the distribution of customers across the different segments.“
Expected result format: Chart ✅
Result accuracy: Correct ✅
Query #6: “Plot a bar chart displaying the distribution of customers across the different segments, each segment should be a different color, and the bars should be labeled with the customer count.“
Expected result format: Chart ✅
Result accuracy: Correct ✅
The EDA tests I ran were simple but realistic, and PandasAI gave me the right outputs in the format I expected. Honestly, it felt like a big step up from when I first tried it a couple of years ago, which is pretty much what I hoped to see.
💡 By the way, if you’d like to run through the code I used for this test, here is the GitHub repo.
Wait…what about speed and efficiency?
One thing you are all probably wondering is how PandasAI performs with different dataset sizes. At first glance, you might expect latency to grow as the data gets bigger.
But that’s not quite how it works.
As we mentioned earlier, PandasAI doesn’t stream your entire dataset into the LLM. Instead, it only sends metadata (like column names, a preview of rows, and context). The LLM generates Python code, and then pandas executes it locally.
That means the bottleneck is almost always the LLM round-trip, not the dataset size.
In practice, my benchmarks confirmed this. Whether I used 5K, 10K, or 20K rows, the average response time stayed in the same ballpark (around 24–26 seconds across queries):
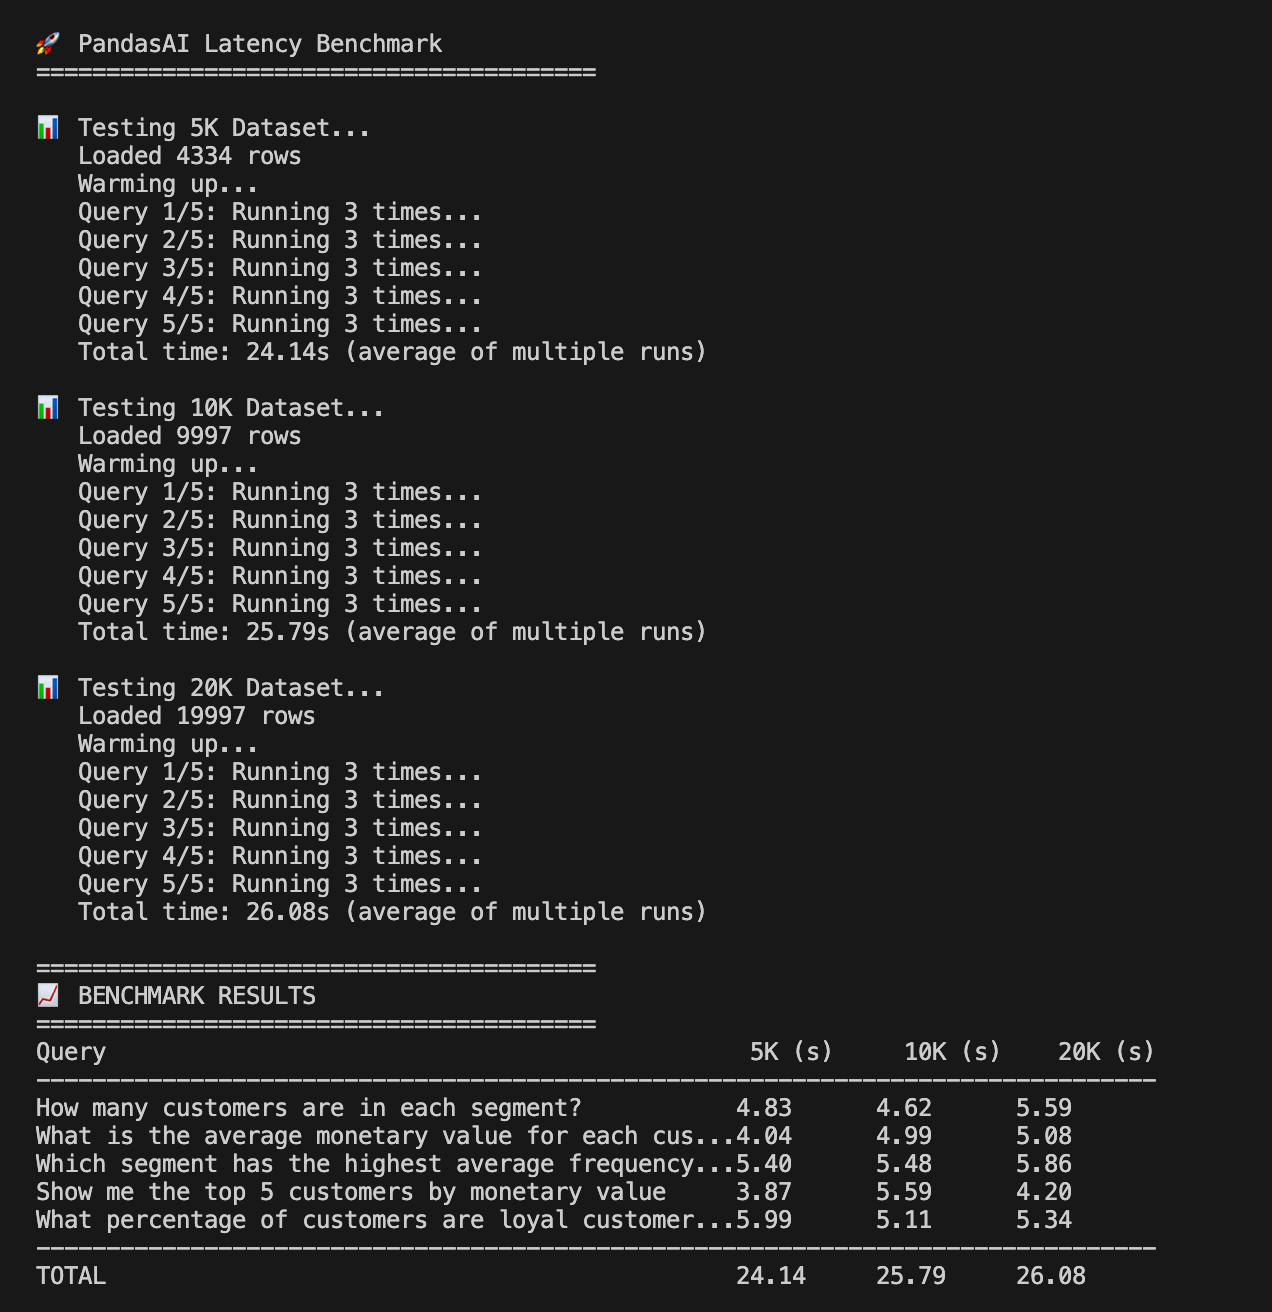
💡 So the lesson here is simple: don’t bother benchmarking PandasAI on raw I/O. What you’re really testing is how well the LLM interprets your question and generates working pandas code.
Getting the most out of PandasAI
PandasAI is not a silver bullet. It works well for straightforward EDA, but once you start asking more complex questions, its limitations become obvious.
In my experience, the bigger issues show up when you try multi-part queries that get misinterpreted or when the generated code turns out clunky. Most of the time, though, that comes down to using PandasAI the wrong way and being a bit too loose in how you set things up.
Here are 5 lessons learned to help you work with it effectively:
Keep queries focused: Instead of asking “calculate the average purchase value per segment and plot the distribution,” split it into two separate steps.
Name your fields clearly:
customer_idandpurchase_amount_usdwork much better thancidandp_amt. Ambiguous names make the LLM guess, and that usually backfires.Add domain hints when needed: A short note like “monetary_value is purchase amount in USD” gives the model the context it won’t infer on its own.
Iterate step by step: If you need a complex chart, first ask for the summary stats, then move on to the visualization. Smaller steps give more reliable outputs.
Stick to exploration: PandasAI is great for quick checks and sanity tests, but don’t expect it to build full pipelines or production-ready scripts.
📣 Quick announcement
Over the past few months, I’ve started integrating AI more and more into my data science workflows, and I can say with confidence that it has helped me 10x my work.
👉 If you’re interested in building systems that use AI to streamline your workflow, from exploratory analysis to reporting and beyond, I’m building a course designed especifically for data scientists (and data professionals).
Join the waitlist, I’ll be sharing more soon.
The Verdict (Part One)
As fun as it is to “talk to your data,” PandasAI is not a magic replacement for pandas or matplotlib.
From my tests, it works best when you use it for the kind of lightweight, repetitive queries that normally take a few minutes to type out. It is not meant to handle every part of an EDA workflow, and if you try to throw everything at it, you will probably get frustrated.

💡 Think of it this way: PandasAI shines when you already have a clean dataset and just want to explore it faster. But when it comes to heavier lifting like complex joins, large-scale transformations, or deeply customized visualizations, you are better off sticking with regular pandas and your own code.
…but that’s not the end of the story
This article is just part one. I focused here on the basics: what PandasAI is, how it works under the hood, some simple benchmarks, and what you should keep in mind when using it for everyday EDA.
But PandasAI goes further.
In Part 2, I dive into some of the more advanced features, like:
Building a semantic layer
Adding domain context to guide the agent
Training it to handle your own style of queries
That’s where things start to get a lot more interesting.
A couple of other great resources:
💼 Job searching? Applio helps your resume stand out and land more interviews.
🤖 Struggling to keep up with AI/ML? Neural Pulse is a 5-minute, human-curated newsletter delivering the best in AI, ML, and data science.
🤝 Want to connect? Let’s connect on LinkedIn, I share lots of career bite-sized advice every week.
Thank you for reading! I hope this guide helps you start using PandasAI like a pro (and don’t forget to join the waitlist for the “Future Proof AI“ course)
See you next week!
- Andres
Before you go, please hit the like ❤️ button at the bottom of this email to help support me. It truly makes a difference!
Great article. Thanks!
You might be interested, I created a Python notebook from this. Of course I gave you credit for the idea!
https://github.com/billglennon/demo-pandasai/blob/main/demo-pandasai.ipynb